Redis in Production: The Config That Prevents the Pager
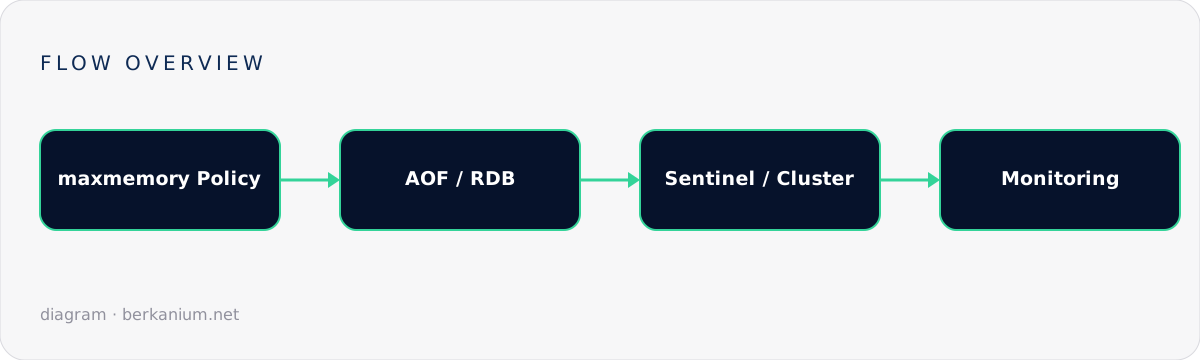
Organized by the incident it prevents: maxmemory and eviction policies, AOF vs RDB persistence blends, Sentinel vs Cluster reality, the fork-memory trap and the five-number dashboard.
Redis has a cruel property: the default configuration works so well in development that most teams never read the config file until the day it matters — which is the day Redis ate all the RAM, or restarted empty, or split-brained during a failover. I've been paged for all three. Here's the configuration walkthrough that prevents them, organized by the incident it prevents.
Incident #1: "Redis is using how much memory?"
Unconfigured, Redis grows until the OS kills it — taking every session, queue job and lock with it. Two lines prevent this:
# redis.conf
maxmemory 6gb                      # ~75% of the box; Redis needs headroom for
                                   # copy-on-write during persistence forks
maxmemory-policy allkeys-lru       # for a CACHE instance
The policy is a real decision, not a default to copy:
allkeys-lru/allkeys-lfu— evict anything, least-recently/frequently used first. Correct for pure caches. LFU is better when your access pattern has stable hot keys and long tails.volatile-lru— evict only keys that have TTLs. Tempting middle ground; in practice it means one forgotten no-TTL key family slowly strangles everything that does expire.noeviction— writes fail when full. Sounds bad, is correct for queues, locks, and sessions: a loud write error beats silently evicting someone's job. This is the policy conflict from the previous post that forces cache and durable workloads onto separate instances.
While you're here: lazyfree-lazy-eviction yes and friends move big deletions off the main thread — free latency insurance on modern Redis.
Incident #2: "Redis restarted and everything is gone"
Persistence has two mechanisms, and the right answer is usually a blend:
# RDB: point-in-time snapshots — compact, fast restarts, loses minutes
save 900 1
save 300 100
save 60 10000

# AOF: append-only log of writes — loses ≤1 second, bigger files, slower restart
appendonly yes
appendfsync everysec               # the sane middle: 'always' murders throughput,
                                   # 'no' trusts the OS more than I do
aof-use-rdb-preamble yes           # hybrid format: RDB snapshot + AOF tail
Decision guide by workload: pure cache — persistence off entirely is legitimate (cold cache after restart beats fork overhead), just make sure the app survives a cold start without a stampede. Queues/locks/sessions — AOF everysec, non-negotiable. The trap: persistence forks the process, and copy-on-write can briefly double memory under write-heavy load. That's why maxmemory sits at ~75%, and why "Redis got OOM-killed during the backup" is such a classic. If you see latest_fork_usec climbing in INFO, your snapshots are hurting.
Incident #3: "the primary died and nobody was promoted" (or worse: two were)
High availability options, in order of increasing machinery:
- Replication alone — a replica plus manual failover. Honest, simple, fine when minutes of downtime are acceptable and a human is around. Set
min-replicas-to-write 1so a lonely primary stops accepting writes it can't replicate. - Sentinel — three+ sentinel processes monitor and auto-promote. The workhorse for single-shard setups. Rules: sentinels on separate failure domains (not all on the Redis boxes), an odd number of them, and clients that actually speak Sentinel (most do; verify — connecting to a static IP defeats the whole thing).
- Cluster — sharding + HA when the dataset outgrows one primary. It changes application semantics: multi-key operations and Lua scripts only work when keys share a slot (hash tags
{user:42}:profile), and some libraries handle redirects poorly. Adopt it for data size, not reflexively for HA — Sentinel covers HA with far less complexity.
Whichever tier: rehearse the failover. Kill the primary in staging and watch. The gap between "we have Sentinel" and "failover actually works with our client libraries and timeouts" is where the 3 a.m. incident lives.
The five numbers on my Redis dashboard
INFO stats / memory / persistence — feed these to your metrics stack:
1. used_memory vs maxmemory        → the eviction cliff, seen in advance
2. evicted_keys rate               → nonzero on a queue instance = incident
3. keyspace hit rate               → cache honesty (per INFO: hits/(hits+misses))
4. connected_clients + blocked     → connection leaks announce themselves here
5. latest_fork_usec                → persistence pain, before users feel it
Plus SLOWLOG GET in your runbook — the single-threaded model means one careless KEYS * or fat Lua script stalls everyone; slowlog names the culprit. Wire the metrics into the same observability stack as everything else, and give the queue-Redis an alert distinct from the cache-Redis — their "bad" looks completely different.
The checklist
- maxmemory set, policy chosen per workload, cache and durable data on separate instances ✔
- AOF everysec on anything you'd miss; persistence consciously off on pure cache ✔
- Sentinel (or your cloud's managed equivalent) with rehearsed failover ✔
- Protected:
requirepass/ACLs on, no public bind,rename-command FLUSHALL ""if you're paranoid (be paranoid) ✔ - Five metrics + slowlog wired to dashboards and alerts ✔
Managed Redis (ElastiCache, Upstash & co.) makes several of these someone else's checkbox — but maxmemory policy, instance separation and client-side failover behavior remain yours. If your Redis is one instance doing five jobs with default everything, let's fix it before it fixes itself.