Metrics, Traces, Logs: OpenTelemetry in Anger
Three signals and the different questions they answer, the trace-ID join that delivers 80% of the value, the collector pattern, tail-based sampling that keeps the interesting 100%, and the incident-driven rollout.
There's a moment in every production system's life when "check the logs" stops being a plan. The request fans out across services, queues and third parties; the error is real but the log line is fine; latency is up but nothing looks slow. That moment is when observability graduates from buzzword to necessity — and OpenTelemetry (OTel) is the industry finally agreeing on how the plumbing works. Here's the practical version: the three signals, the collector pattern, and a rollout that pays for itself in the first incident.
Three signals, three different questions
- Logs answer "what happened at this point?" — discrete, detailed events. You (hopefully) have these, centralized and structured. Necessary, insufficient: logs describe points, not journeys.
- Metrics answer "how is the system trending?" — cheap aggregated numbers over time: request rate, error rate, p99, oldest-job age, eviction rates. They power dashboards and alerts, and their fixed cost per time-series (not per event) makes them the only signal you can afford at full resolution, forever.
- Traces answer the question the other two can't: "where did this request's 3.2 seconds actually go?" One trace = one request's journey as a tree of timed spans: 40ms controller → 2,800ms external PSP call → 300ms of 47 identical queries (hello). Distributed tracing propagates the trace ID across HTTP calls, queues and services, stitching the whole story together.
The correlation trick that multiplies all three: trace IDs injected into every log line and echoed in error responses (the trace_id field from the API checklist). Support ticket → trace ID → the exact request's spans, its logs, and its metric context. That single join is 80% of observability's practical value.
Why OpenTelemetry specifically
Because it ends the vendor-lock instrumentation problem. OTel is a CNCF standard: one set of SDKs and semantic conventions for producing signals, one wire protocol (OTLP) for shipping them — and the backend (Jaeger, Tempo, Prometheus/Grafana, Datadog, Honeycomb…) becomes a swappable decision instead of a tattoo. Instrument once, negotiate with vendors forever. The auto-instrumentation story is the on-ramp: .NET's is genuinely excellent (HTTP, EF Core, HttpClient traced with a few lines in Program.cs), PHP/Laravel's has matured into real usability (auto-instrumentation packages covering HTTP, PDO, Redis, queues). You get 70% coverage before writing a single custom span.
// .NET: the whole starter kit
builder.Services.AddOpenTelemetry()
    .ConfigureResource(r => r.AddService("orders-api"))
    .WithTracing(t => t.AddAspNetCoreInstrumentation()
                       .AddHttpClientInstrumentation()
                       .AddEntityFrameworkCoreInstrumentation()
                       .AddOtlpExporter())          // → collector
    .WithMetrics(m => m.AddAspNetCoreInstrumentation()
                       .AddRuntimeInstrumentation()
                       .AddOtlpExporter());
The collector: the pattern that makes it operable
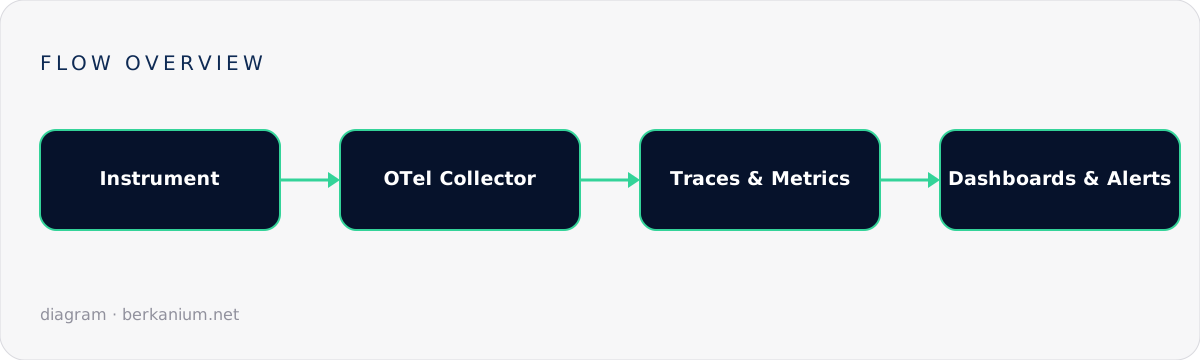
Apps don't ship telemetry straight to backends; they ship OTLP to a local OTel Collector (sidecar or per-node agent), which batches, retries, redacts, samples and routes. This indirection earns its box in the diagram three ways: apps stay backend-agnostic (vendor swap = collector config change, zero deploys), backpressure is absorbed outside your request path (a slow backend must never slow the app — the same fail-open principle as rate limiters), and cross-cutting policy (PII scrubbing, sampling) lives in one place instead of every service. On Kubernetes it's a DaemonSet plus a deployment-tier gateway; on plain VMs, one binary under systemd.
Sampling: the bill-shaped elephant
Tracing every request at scale costs real money, and the naive answer (sample 1% at random) throws away exactly the traces you wanted — the slow and broken ones are rare by definition. The grown-up answer is tail-based sampling in the collector: buffer each trace briefly, then keep it if it erred or exceeded a latency threshold, plus a small random slice of normal traffic for baselines. Config, not code:
# otel-collector: keep the interesting 100%, sample the boring 5%
processors:
  tail_sampling:
    policies:
      - name: errors        type: status_code    status_code: {status_codes: [ERROR]}
      - name: slow          type: latency        latency: {threshold_ms: 1500}
      - name: baseline      type: probabilistic  probabilistic: {sampling_percentage: 5}
The rollout that works (and the one that doesn't)
The failed version I keep seeing: a quarter-long "observability initiative" that instruments everything, dashboards nothing, and dies in review. The version that works is incident-driven and incremental: week one, auto-instrumentation + collector on your two most-blamed services, trace IDs into logs; week two, the four golden signals (rate, errors, duration, saturation) on one dashboard per service, alerts on symptoms users feel (error rate, p99) rather than causes (CPU); then, custom spans added during incident retros — every "we couldn't see X" becomes a span or metric that week. Six months of that beats any big-bang initiative, because each addition was purchased by a real question nobody could answer.
The end state is quietly transformative: "why was checkout slow for this customer yesterday at 14:03" goes from a half-day archaeology dig to a ninety-second trace lookup. Systems don't get simpler — but they can stop being opaque, and opacity, not complexity, is what actually burns teams out.
This post closes the operations loop with logging and Kubernetes. Want the week-one setup done in an actual week? That's a well-shaped project brief.