Elasticsearch in Production: Shards, Heap and the ILM Religion
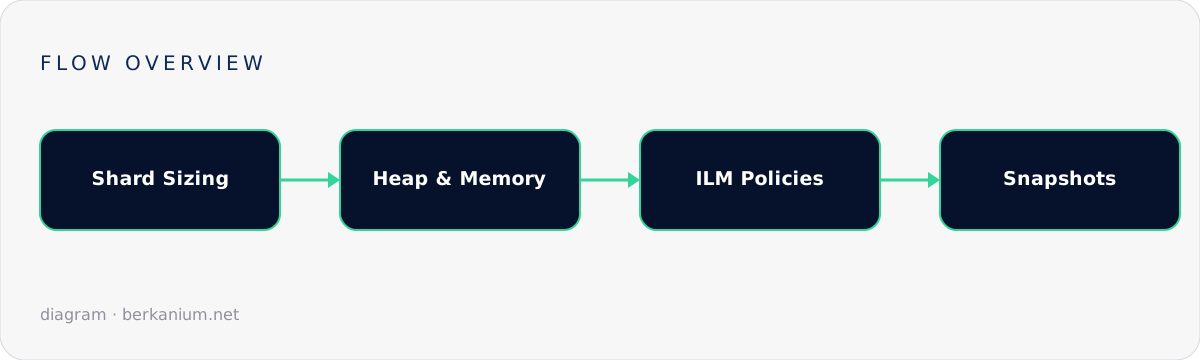
Shard sizing between the two failure modes, the 50%/30GB heap rules and why the other half matters, master quorum and watermarks, ILM tiering for log workloads, and snapshots you have actually restored.
Elasticsearch in development is a friendly Docker container. Elasticsearch in production is a distributed system with opinions about memory, a shard model that punishes both extremes, and a habit of turning small configuration oversights into weekend-consuming incidents. Having operated clusters from "one node with delusions" to "enough data to make ILM a religion", here's the production configuration that actually matters, in the order it usually bites.
Shards: the decision you make early and live with
Every index splits into primary shards (fixed at creation!) with replica copies. Two failure modes, both common:
- Oversharding — the classic. Someone keeps daily indices with 5 primaries × 2 replicas of 200MB each, and two years later the cluster manages 11,000 shards, each carrying fixed heap overhead, and the master node spends its life doing shard bookkeeping. Symptoms: slow cluster-state updates, endless rebalancing, heap pressure with modest data.
- Undersharding — one 900GB shard that can't be split without reindexing, recovers glacially after node loss, and makes every merge an event.
The working heuristics: aim for 10–50GB per shard (logs/metrics toward the high end, search-latency-sensitive toward the low), keep total shards well under ~20 per GB of heap on data nodes, and for time-series data don't pick daily-vs-weekly at all — use rollover (via ILM, below) so indices cut at a size target instead of a calendar. For a typical product-search index of a few tens of GB: one primary, one or two replicas is the right answer far more often than the default suggests. Replicas, remember, buy both redundancy and read throughput — they're the knob you can turn later; primaries aren't.
Memory: the 50% rule and the other half
# jvm.options — the two lines that matter
-Xms16g
-Xmx16g          # identical min/max; ≤ 50% of RAM; and ≤ ~30GB, full stop
Three constraints in one line: heap min = max (no resize pauses), heap ≤ half the machine's RAM — because the other half is not wasted: Lucene reads segments through the OS filesystem cache, and that cache is where query speed actually lives — and heap under ~30GB so the JVM keeps compressed object pointers (cross the line and you lose more memory to fatter pointers than you gained). A 64GB box wants ~26–30GB heap, not 48. Also: bootstrap.memory_lock: true so the heap never swaps — a swapping Elasticsearch node is a node-shaped liability.
The cluster layout that prevents split-brain and sadness
- Three master-eligible nodes, always odd, ideally small and dedicated once you're past ~6 data nodes. Modern versions handle quorum automatically — your job is just to give them three homes in separate failure domains.
- Dedicated coordinating-only node(s) in front of heavy aggregation traffic, so a monster dashboard query OOMs a stateless node instead of a data node holding primaries.
- Watermarks are behavior, not suggestions: at 85% disk (default) allocation stops; at ~95% indices flip to read-only (
read_only_allow_delete) — which is the true story behind half the "writes suddenly fail with 403" incidents I've seen. Monitor disk before the watermark does.
ILM: retention as config, not cron jobs
Index Lifecycle Management moves time-series indices through tiers automatically — the single biggest cost lever on log-heavy clusters:
PUT _ilm/policy/logs
{
  "policy": { "phases": {
    "hot":    { "actions": { "rollover": { "max_primary_shard_size": "40gb", "max_age": "3d" } } },
    "warm":   { "min_age": "7d",  "actions": { "shrink": { "number_of_shards": 1 },
                                               "forcemerge": { "max_num_segments": 1 } } },
    "cold":   { "min_age": "30d", "actions": { "allocate": { "require": { "tier": "cold" } } } },
    "delete": { "min_age": "90d", "actions": { "delete": {} } }
  } }
}
Hot indices roll at 40GB; week-old data shrinks and force-merges (smaller, faster, cheaper); month-old data migrates to big-disk nodes; 90-day-old data leaves. Nobody wakes up for any of it. If you run the Graylog-style logging stack, this is the layer that keeps the disk-full incident permanently fictional.
Snapshots: replicas are not backups
Replicas protect against node loss, not against DELETE products, a mapping migration gone wrong, or a corrupted upgrade. Snapshot to object storage (S3/GCS/MinIO) on a schedule with SLM, and — the part everyone skips — rehearse a restore quarterly. A snapshot you've never restored is a hope, not a backup. Snapshots are incremental at the segment level, so hourly costs far less than it sounds.
The dashboard that pages me before users do
1. Cluster status         green/yellow/red — yellow means replicas unassigned; ask why
2. Heap % + GC time       sustained >75% heap or growing GC = trouble brewing
3. Disk vs watermarks     with days-until-full math, not just a percentage
4. Search & indexing      p99 latency + thread-pool REJECTIONS (rejections are
                          the cluster saying "no" — never ignore them)
5. Pending tasks + shard count   the oversharding early-warning pair
Wire it into the same metrics stack as everything else. And one closing philosophical note: if this whole post feels like a lot of operational surface for your ten thousand products — it is, and the next post is about the alternatives that give you 90% of the search with 10% of the cluster.
Cluster misbehaving in ways this post rudely predicted? I do Elasticsearch health checks — bring the _cluster/stats output and an hour.