Centralized Logging with Graylog: From tail -f to Actually Seeing Things
Why I keep coming back to Graylog for self-hosted log management: the GELF setup, structured logging from .NET and Laravel, streams that route and alert, and the retention math nobody does.
Every team has the same logging origin story. It starts with tail -f on one server. Then there are three servers, and someone writes a for-loop over SSH. Then a container restarts at 03:14 and takes its logs to the grave, and the incident review has a slide that just says "we couldn't see anything". That slide is how centralized logging budgets get approved.
I've set up the ELK stack, I've paid the Datadog bill, and I keep coming back to Graylog for a specific niche: teams that want real log management, on their own infrastructure, without hiring an Elasticsearch whisperer. Here's how I wire it up, with the .NET and PHP sides included, and the mistakes you get to skip.
Why Graylog, specifically
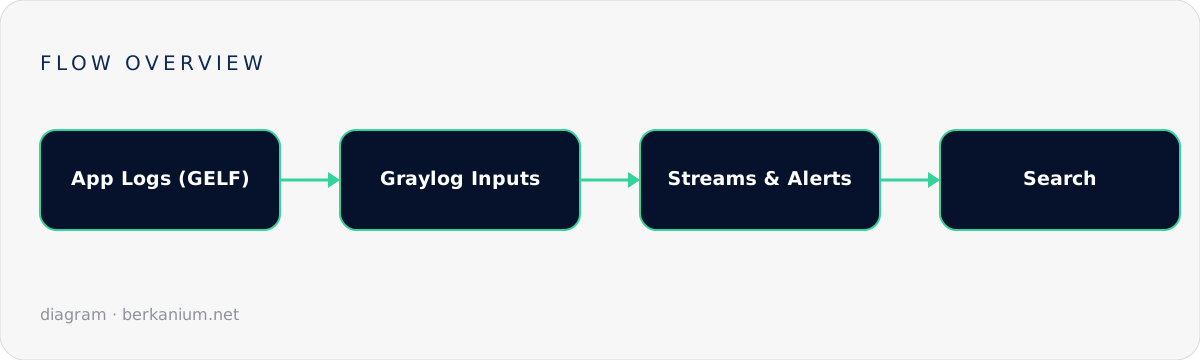
Three honest reasons. One: GELF — the Graylog Extended Log Format — is a dead-simple structured envelope (JSON, UDP/TCP/HTTP) with mature libraries in every language I ship. Two: streams and pipelines give you routing and parsing in the server, so the twelfth microservice doesn't need its own log-shipping opinion. Three: the operational surface is one service plus its storage backend, which a two-person platform team can actually own. That's the whole pitch. If you're already paying for a hosted observability suite and it's fine — keep it. This article is for the self-hosted crowd.
The setup, minus the yak-shaving
A production-worthy small deployment is Graylog + OpenSearch + MongoDB (Mongo only stores config, don't panic). Docker Compose is legitimate for a single node handling a few thousand messages a second:
services:
  mongodb:
    image: mongo:7
    volumes: [mongo:/data/db]

  opensearch:
    image: opensearchproject/opensearch:2
    environment:
      - discovery.type=single-node
      - plugins.security.disabled=true       # it's on a private network. It IS, right?
      - OPENSEARCH_JAVA_OPTS=-Xms2g -Xmx2g
    volumes: [osdata:/usr/share/opensearch/data]

  graylog:
    image: graylog/graylog:6.1
    environment:
      - GRAYLOG_PASSWORD_SECRET=${GRAYLOG_SECRET}
      - GRAYLOG_ROOT_PASSWORD_SHA2=${ROOT_PW_SHA2}
      - GRAYLOG_HTTP_EXTERNAL_URI=https://logs.internal.example.com/
    ports:
      - "9000:9000"       # UI
      - "12201:12201/udp" # GELF input
    depends_on: [mongodb, opensearch]

volumes: { mongo: {}, osdata: {} }
First thing after login: create a GELF UDP input on 12201 and send yourself a test message. Do not skip the test message; "the input was never actually listening" has wasted more collective hours than any parser bug.
echo '{"version":"1.1","host":"laptop","short_message":"hello graylog","_env":"dev"}' \
  | nc -u -w1 logs.internal.example.com 12201
Shipping from .NET
Serilog plus the GELF sink, and — the part people forget — properties, not string soup:
// Program.cs
builder.Host.UseSerilog((ctx, cfg) => cfg
    .Enrich.WithProperty("app", "orders-api")
    .Enrich.WithProperty("env", ctx.HostingEnvironment.EnvironmentName)
    .WriteTo.Graylog(new GraylogSinkOptions
    {
        HostnameOrAddress = "logs.internal.example.com",
        Port = 12201,
        TransportType = TransportType.Udp,
    }));

// Somewhere in a handler — structured, searchable, aggregatable:
log.Information("Order {OrderId} paid {Amount} via {Provider} in {Elapsed}ms",
    order.Id, order.Total, "stripe", sw.ElapsedMilliseconds);
That template becomes fields: OrderId, Provider, Elapsed. Six months later you will search Provider:stripe AND Elapsed:>2000 and feel like a wizard. Log "Order 123 paid" as a flat string instead and future-you gets regex homework.
Laravel folks: same idea, five lines — a gelf channel via hedii/laravel-gelf-logger in config/logging.php, then Log::info('order paid', ['order_id' => …]). The context array becomes GELF fields the same way.
Streams: the feature that pays the rent
Everything-in-one-bucket is where most logging setups stall. Graylog's streams route messages by rule the moment they arrive — and each stream gets its own retention, permissions and alerts:
env:prod AND level:<=3→ prod-errors stream → alert to the on-call channel, keep 90 days.app:payments→ payments stream → finance-adjacent folks get read access to this and nothing else, keep 1 year (your auditor says hi — see why payment logs matter)._http_status:>=500from the ingress → 5xx stream → feeds a dashboard the team actually looks at on Mondays.
Alerting tip from a scar: alert on absence too. "Zero messages from orders-api in 10 minutes" has caught more dead deployments for me than any error-rate threshold, because a crashed service is remarkably quiet.
Retention, or: how logs eat disks
Logs grow at the speed of your most enthusiastic debug statement. Decide retention per stream on day one — 7 days for chatty debug, 90 for errors, a year for anything money-adjacent — and let index rotation delete the rest. The alternative is a full disk on the log server, which fails with the special irony of being the one outage you can't read the logs for.
The rules I actually enforce in code review
- Structured properties, never interpolated strings.
- Every request gets a correlation id, and it's on every log line of that request. Distributed debugging without one is guesswork with extra steps.
- No secrets, no PANs, no tokens in logs. Graylog pipelines can mask, but the best redaction is the log line you didn't write.
- Log the decision, not the mechanics: "payment declined, code=51" beats four lines of "entering method X".
If your incident reviews still contain the "we couldn't see anything" slide, that's fixable in about a week — tell me about your stack. Pairs well with the Rancher fleet piece: one Fleet repo can roll this whole stack out.