Kubernetes for Teams That Ship: The YAML I Actually Use
The four objects that carry a production service, annotated line by line: probes that don't lie, honest resource requests, zero-downtime rollouts, HPA caveats and the boring starter kit that ages well.
Kubernetes documentation has a strange property: it explains every object in isolation and none of them in combination. You can read about Deployments for an hour and still not know what a boring, production-worthy web service actually looks like — probes, limits, rollout settings, the works. This post is the combination. It's the YAML I actually ship, annotated with the why behind every line, plus the handful of concepts that separate "it runs on my cluster" from "it survives Tuesday".
Fair warning: this is the application-team view. If you're wrangling multiple clusters, that's a different article — I wrote it: Rancher in production. Here we're inside one cluster, shipping one service, doing it properly.
The mental model in one paragraph
Kubernetes is a control loop wearing a trench coat. You write down a desired state ("three replicas of this container, reachable on port 80") and controllers work forever to make reality match. That's the entire trick. Pods die, nodes vanish, deploys roll — the loop reconciles. Once you internalize that you never command Kubernetes, you describe to it, half the API starts making sense. The other half is networking, and we'll get there.
The four objects that carry 90% of the weight
A web service needs exactly four kinds of YAML, and here's the first one with everything I consider non-negotiable:
# deployment.yaml
apiVersion: apps/v1
kind: Deployment
metadata:
  name: orders-api
  labels: { app: orders-api }
spec:
  replicas: 3
  selector:
    matchLabels: { app: orders-api }
  strategy:
    rollingUpdate:
      maxUnavailable: 0        # never dip below capacity during deploys
      maxSurge: 1
  template:
    metadata:
      labels: { app: orders-api }
    spec:
      containers:
        - name: app
          image: registry.example.com/orders-api:1.42.0   # a TAG. Never :latest.
          ports: [{ containerPort: 8080 }]

          resources:
            requests: { cpu: 100m, memory: 256Mi }   # what the scheduler reserves
            limits:   { memory: 512Mi }              # note: no CPU limit — see below

          readinessProbe:                # "can I take traffic?"
            httpGet: { path: /healthz/ready, port: 8080 }
            periodSeconds: 5
          livenessProbe:                 # "am I hopelessly stuck?"
            httpGet: { path: /healthz/live, port: 8080 }
            initialDelaySeconds: 10
            failureThreshold: 3

          envFrom:
            - configMapRef: { name: orders-api-config }
            - secretRef:    { name: orders-api-secrets }

          lifecycle:
            preStop:
              exec: { command: ["sleep", "5"] }   # drain window; more below
Then the plumbing that gets traffic to it:
# service + ingress
apiVersion: v1
kind: Service
metadata: { name: orders-api }
spec:
  selector: { app: orders-api }        # matches pod labels — this IS the wiring
  ports: [{ port: 80, targetPort: 8080 }]
---
apiVersion: networking.k8s.io/v1
kind: Ingress
metadata:
  name: orders-api
  annotations:
    cert-manager.io/cluster-issuer: letsencrypt
spec:
  rules:
    - host: api.example.com
      http:
        paths:
          - path: /
            pathType: Prefix
            backend: { service: { name: orders-api, port: { number: 80 } } }
  tls: [{ hosts: [api.example.com], secretName: orders-api-tls }]
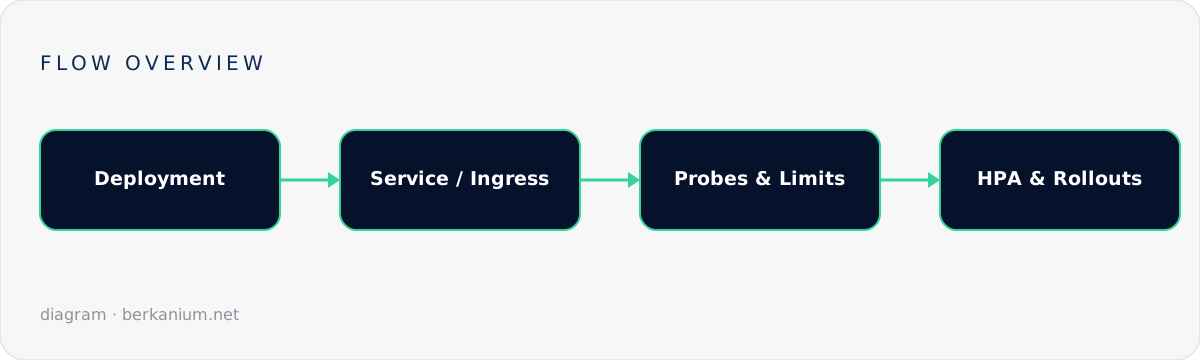
Deployment, Service, Ingress, plus a ConfigMap/Secret pair. That's the whole show for most APIs. Everything else in the ecosystem — Helm, Kustomize, operators — is a way of generating or templating these four things.
The lines people get wrong, ranked by pain caused
1. Probes that lie
The readiness probe answers "should the Service send me traffic?" and the liveness probe answers "should the kubelet kill me?" They are different questions and wiring both to the same endpoint is how outages amplify. The classic disaster: your readiness check pings the database; the database blips; every pod goes unready simultaneously; the Service has zero endpoints; a 2-second DB hiccup becomes a full outage. My rule — readiness checks this process (can I serve?), liveness checks only "is the event loop/thread pool alive", and neither checks downstream dependencies. Your circuit breakers handle downstreams; probes handle the process.
2. Resources: requests too low, limits too enthusiastic
Requests are a scheduling promise; limits are an enforcement wall. Two specific mistakes: setting memory requests below real usage (node fills up, the OOM killer starts choosing victims, and it has terrible taste), and setting CPU limits at all on latency-sensitive services — CPU limits cause throttling that shows up as mysterious p99 spikes while average CPU looks fine. My defaults: memory request = observed steady state + headroom, memory limit = same-ish (make OOM deterministic), CPU request honest, CPU limit absent. Measure with kubectl top pods for a week before trusting any number, including mine.
3. Deploys that drop requests
Rolling updates kill pods that are mid-request unless you handle shutdown. The sequence on termination is: pod marked terminating → removed from Service endpoints → SIGTERM → (grace period) → SIGKILL. The catch: endpoint removal propagates concurrently with SIGTERM, so for a second or two, traffic still arrives at a process that's shutting down. Hence the preStop: sleep 5 above — it delays SIGTERM until the endpoint update has propagated — combined with an app that handles SIGTERM by finishing in-flight requests. In ASP.NET Core and Laravel Octane this is built in; in a bare PHP-FPM setup, test it. maxUnavailable: 0 completes the trio: never trade capacity for deploy speed.
4. :latest and its cousin, the mutable tag
If the tag doesn't change, Kubernetes doesn't know anything changed, and "it deployed but nothing happened" tickets are born. Immutable tags (version or git SHA), always. Bonus: rollback becomes kubectl rollout undo or — better — a git revert, if you've wired GitOps, which quietly solves the "who changed what" question forever.
Scaling: the HPA, honestly assessed
apiVersion: autoscaling/v2
kind: HorizontalPodAutoscaler
metadata: { name: orders-api }
spec:
  scaleTargetRef: { apiVersion: apps/v1, kind: Deployment, name: orders-api }
  minReplicas: 3
  maxReplicas: 12
  metrics:
    - type: Resource
      resource:
        name: cpu
        target: { type: Utilization, averageUtilization: 70 }
  behavior:
    scaleDown:
      stabilizationWindowSeconds: 300    # don't flap on every quiet minute
The Horizontal Pod Autoscaler works, with two caveats the tutorials skip. First, it scales on the ratio of usage to requests — garbage requests in, garbage scaling out. Second, CPU is a proxy metric; for queue workers, scale on queue depth (KEDA is excellent for this) rather than pretending CPU correlates with backlog. And min replicas is a floor for availability, not cost: two minimum, spread across nodes with a topologySpreadConstraint, or your "highly available" service shares a single node's fate.
State, config and the things Kubernetes is worse at
Quick honesty round. Secrets are base64, not encryption — anyone with API read access reads them; use external secret operators or at least RBAC-restrict them. Databases in-cluster: you can, via operators, and for dev clusters I do — but for production, a managed database is somebody else's pager, and that's a feature. CronJobs are fine for cluster chores, but application-level scheduling with business logic belongs in the app (Quartz.NET, for the .NET crowd) where it can be idempotent, observable and testable. And logs: stdout, structured, shipped somewhere central — pods are cattle and their local logs die with them, which is the entire plot of the Graylog piece.
A starter kit that has aged well
- Four YAMLs per service, in the service's own repo, applied by CI or GitOps — never by hand from a laptop.
- Probes split (ready vs live), no dependency checks in either.
- Honest requests, deterministic memory limits, no CPU limits on the hot path.
maxUnavailable: 0, preStop sleep, SIGTERM handled in-app.- Immutable image tags; rollback is a revert.
- One namespace per team or per app-group, with ResourceQuotas before your neighbor's memory leak becomes your incident.
- HPA only after you've watched real metrics for a week.
None of this is clever. That's the point — Kubernetes rewards boring, and the teams that struggle with it are usually fighting their own cleverness, not the platform.
Standing up Kubernetes, or standing in the wreckage of a first attempt? Both are solid reasons to book a session — bring your YAML, I'll bring the red pen. The multi-cluster sequel and the CI pipeline that feeds it round out the series.